

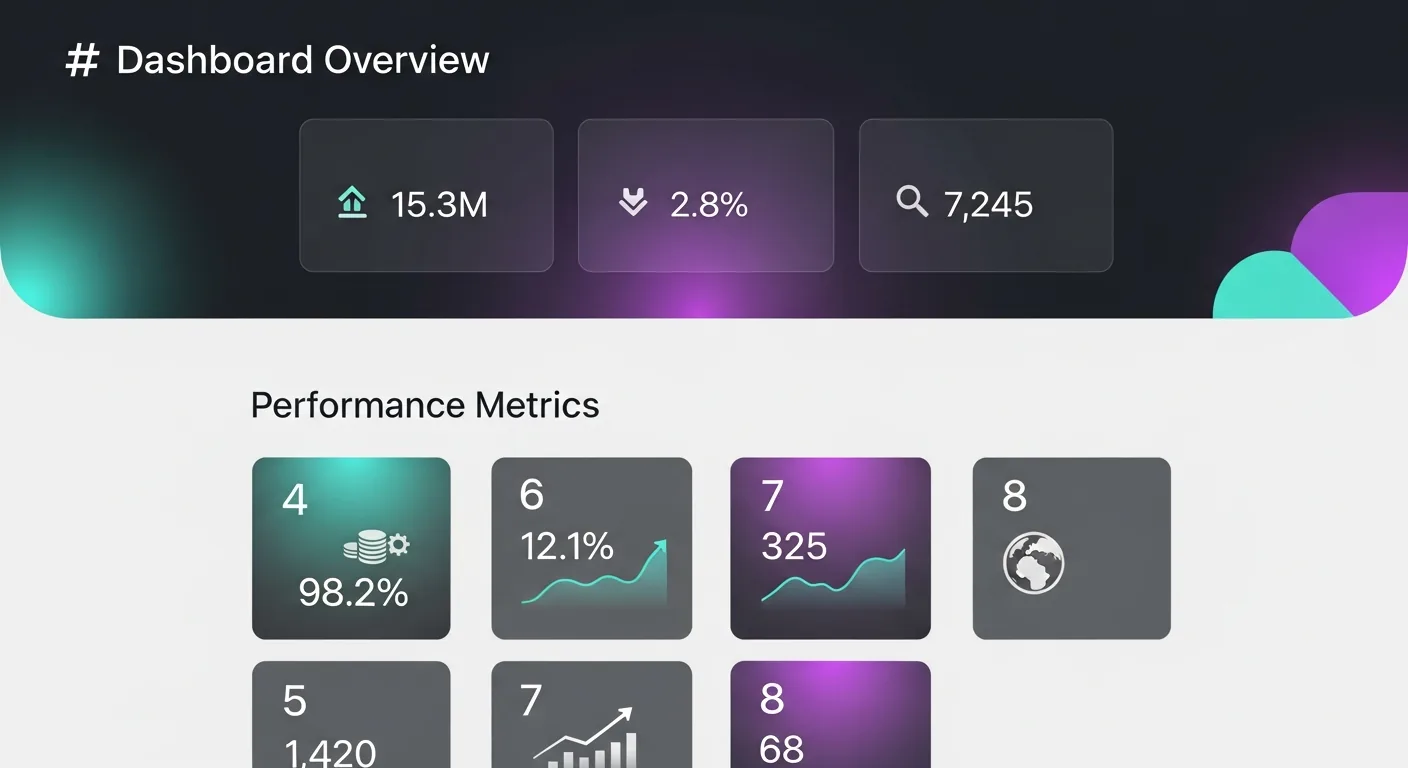
Not hundreds of metrics, but a management dozen: 12 numbers that give the owner enough signals for decisions without diving into extra noise.
The most common extremes: watching a single metric like ROMI, or drowning in 60 dashboard fields. Neither helps you actually run the business.
Business owners often drown in reports or, on the contrary, have no control system at all — and learn about problems too late. "Sales are stalled" turns out to be at the end of the month, and the cause is a broken lead process that has been down for two weeks. The 12 KPIs in this article close that gap: the owner sees the real picture in 15 minutes every week.
Key principle: no more than 12. More, and no one will look. These 12 are split into 4 groups: marketing, sales, operations, finance. Each group has 3 metrics that give a quick read on the health of that block.
Marketing (3 KPIs)
How many new leads or qualified contacts came in this week. Compare with the previous week and the same week last year. A sharp drop is a signal to check your ads and organic traffic.
Ad spend / number of leads. If CPL spikes — either auction competition rose, landing quality dropped, or you ran out of audience.
Organic trend shows the long-term health of your content strategy. Branded queries show growing awareness — important for B2B where the decision cycle is long.
Sales (3 KPIs)
Percentage of leads that become qualified conversations. If it drops, either traffic quality worsened or the response SLA was breached. B2B target: 25-40%.
Total value of all deals in CRM with "active negotiations" status. If pipeline is under 3× monthly plan — you'll have a revenue problem in 2-3 months.
The percentage of SQLs that close into deals. A sharp drop is a signal to analyze rejection reasons. Usually: price, competitor, or "wrong decision-making level" on the call.
Operations (3 KPIs)
Average time from lead receipt to first contact. Target: <30 minutes during business hours, <2 hours after hours. Every extra hour costs conversions.
Customer satisfaction and repeat order rate. In B2B, retention is often cheaper than acquisition. If NPS drops — the problem is delivery, not marketing.
Percentage of customers lost per month. Target: <5% monthly for a retainer model. On reasons: match churn with customer profile — there's often a "who leaves" pattern.
Finance (3 KPIs)
If you have a subscription or retainer model, MRR (monthly recurring revenue) is the core financial metric. The trend matters more than the absolute value.
All marketing + sales costs / number of new customers. Compare with LTV: target CAC/LTV <33%. If higher — either increase LTV or lower acquisition cost.
Not all customers are equally profitable. Some channels bring in low-ticket clients or ones that are hard to deliver. Gross margin per channel shows where the real money is.
How to build a dashboard without a BI team
Simple stack for weekly review:
- Google Sheets + Looker Studio: Free. Sheets as a database (manual entry or API), Looker Studio for visualization. Enough for most small/mid-size B2B.
- CRM (HubSpot, Pipedrive): Funnel dashboards and sales KPIs. HubSpot Free covers most of the reports you need.
- Automation: n8n or Zapier pulls data from different sources (GA4, Meta Ads, CRM) into one Sheets document once a week. The Monday review becomes a 15-minute ritual.
Quick diagnosis
Check off the items you already have. This doesn't replace an audit, but it quickly shows how much control you have over the topic.
Entity block by topic
For a page to work for both people and search, it's important to explicitly name key entities and concepts. This makes the topic denser and the solution clearer, without marketing fog.